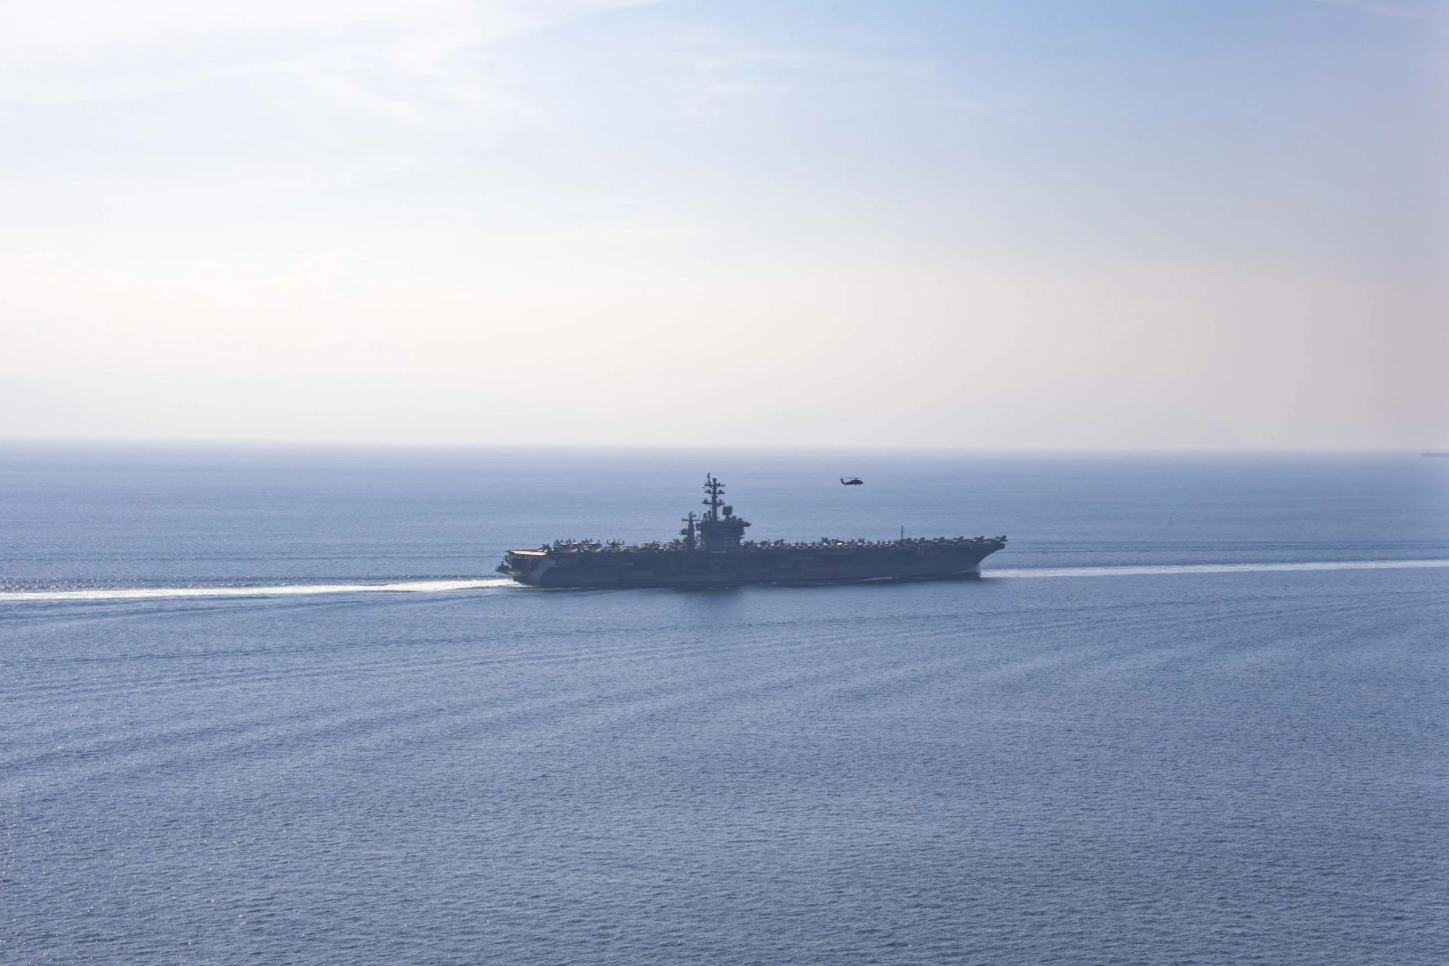
USS Dwight D. Eisenhower transiting the Strait of Hormuz in 2023.
File photo USS Dwight D. Eisenhower transits the Strait of Hormuz, November 2023. This is contextual file photography, not an image of the September 2026 fighting.U.S. Navy · Public domain / Wikimedia Commons
Developing · Reviewed September 7, 2026

Iran War,
American Consequences

How a conflict thousands of miles away is reaching American wallets, politics and daily life.

Latest change in this edition

Reported tanker strikes and renewed shipping restrictions put the Gulf back in focus.

Read it your wayThe briefYour spendingThe evidence
Read the 30-second brief

This edition draws on published reporting and primary data. Military accounts are attributed; Daymark has not independently verified battlefield events. Fuel data: August 31. Polling: August 21–24. No live updates.

Start here

The story in 30 seconds

The latest exchanges put Gulf shipping at the center of the U.S.–Iran conflict. Disruption to energy exports is a route through which the war can affect American fuel costs. But a national pump price cannot isolate the war’s contribution, and polling cannot tell us that Iran will decide November’s elections. [1] [4]

Latest developments

What changed?

Military account

CENTCOM reports tanker strikes

On September 5, CENTCOM said U.S. forces hit three Iranian crude carriers after missiles were launched toward two U.S. Navy ships. It reported no U.S. personnel harmed. This is the U.S. military’s account, relayed by Reuters. [1]

Shipping

Iran signals new restrictions

AP reported on September 6 that Iran planned an exclusion zone near Hormuz. An announced plan is not proof that every proposed restriction has taken effect. [2]

Energy markets

Oil rises after the exchanges

Reuters reported further oil-price gains on September 7 following the ship attacks. Intraday market moves do not establish the size or duration of the eventual effect on pump prices. [3]

From the Gulf to daily life

How the connections work

Select a stage to inspect its evidence. These labels are editorial assessments, not numerical probabilities.

Reported mechanism

Conflict → Export disruption

Dallas Fed researchers describe disruption to Middle Eastern oil and refined-product exports after the war began. Their April work provides economic context, not a current shipping count. [4]

What the evidence settles

Known. Disputed. Unknown.

Known

EIA publishes national fuel-price observations; Ipsos publishes the wording and results of its August survey. These are dated measurements. [6] [7]

Disputed

How much of the current price level is attributable to the war, and whether the military strategy will achieve its objectives at an acceptable cost.

Unknown

When shipping conditions will normalize, the eventual civilian toll, and how much this conflict will affect individual congressional races.

Inspect the reasoning

Claims & evidence

Fuel prices reflect several forcesSupported mechanism

Crude is one input; the other components prevent us from assigning the whole pump-price change to Iran. [5]

What could change our assessment: a credible decomposition of observed prices could identify the contribution of individual factors more precisely.

The war can raise inflationConditional economic analysis

The April Dallas Fed analysis links a supply shortfall to gasoline and inflation under stated assumptions. It is not a retrospective calculation of September’s inflation. [4]

What could change our assessment: new evidence about supply recovery, fuel prices and pass-through would change which scenario is relevant.

Most respondents disapproved of U.S. strikesSupported by a dated survey

In the August 21–24 Reuters/Ipsos poll, 31% approved and 63% disapproved of U.S. military strikes against Iran. The survey covered 1,215 adults; its full-sample sampling error was ±2.9 percentage points at 95% confidence. See question TM3363Y26, page 17. [7]

Limit: this is a snapshot of the surveyed population. It is not a turnout estimate or an explanation of each respondent’s reasons.

The war will decide the midtermsNot established

We have not identified evidence that isolates the conflict as the determining cause of November’s outcome.

Even a later correlation would not, by itself, establish that the war caused a particular result. Follow the Midterms desk →

Dated data, practical context

What it means for your spending

At the pump

EIA’s August 31 averages were $4.071 per gallon for regular gasoline and $5.599 for on-highway diesel. Regular gasoline was $0.894 higher than a year earlier, but $0.014 lower than the previous week. [6]

Illustrative monthly difference: $42.91 more.

Gallons × fills × $0.894. Holds fuel use constant and uses the August 31 national year-over-year difference. This is not an estimate of spending caused by the war.

Beyond gasoline

Diesel prices depend on supply, demand and inventories, including refinery conditions. Higher transport costs can put pressure on businesses, but this edition does not quantify their effect on grocery bills. [8]

Your local fuel price can differ because of taxes, supply access and competition. A national average will not reproduce every driver’s experience. [9]

Keep both populations in view

The consequences inside Iran

American prices are only one part of this story. In March, the ICRC’s head of delegation in Iran described damaged homes and civilian infrastructure, fear for family members and pressure on livelihoods. This is dated humanitarian context, not a September casualty tally. [10]

Reuters reported on September 6 that sanctions and the U.S. blockade were squeezing Iran’s exports and foreign-currency access. Economic pressure on the state does not tell us how evenly the burden falls across households. [11]

Daymark has no original interviews from Iran in this edition. We are not treating official government statements as a complete account of civilian experience. A fuller assessment needs independently corroborated reporting on casualties, essential services and livelihoods.

Update record

How this edition developed

Selected reporting milestones
  1. April 17 — Economic scenarios published

    Dallas Fed researchers set out possible inflation effects under different supply assumptions. [4]

  2. August 21–24 — Public opinion measured

    Ipsos conducts the survey discussed in the claim ledger. [7]

  3. August 31 — Fuel-price observation

    The retail-price date used in the spending example. [6]

  4. September 5–7 — Renewed shipping confrontation

    The attributed reports at the top of this page describe the latest exchanges. [1] [2] [3]

September 7: editorial revision

The September 5 prototype used language stronger than its evidence warranted. We replaced claims about the war’s measured inflation impact with conditional analysis, removed numerical confidence bars, and stopped presenting weak political attribution as established.

The fuel calculation now identifies its comparison and limits. Military statements are attributed. The earlier context selector was removed because it did not restore historical versions. This record describes edits to the page, not a reconstruction of what was known on every prior date.

Corrections

Found something we should revisit?

Prepare a correction note with the claim and supporting evidence. This tool downloads the note to your device; it does not send it to Daymark. A submission channel is not available yet.

Find your story.